Note
Click here to download the full example code
Simulating results
We now use a Poisson regression to fit a model to the Premier League and then we use the estimated values to simulate results between two teams.
This code is adapted from https://dashee87.github.io/football/python/predicting-football-results-with-statistical-modelling/
# importing the tools required for the Poisson regression model
import statsmodels.api as sm
import statsmodels.formula.api as smf
import pandas as pd
import matplotlib.pyplot as plt
import numpy as np
import seaborn
from scipy.stats import poisson,skellam
Import data
Here we use football-data.co.uk
epl = pd.read_csv("https://www.football-data.co.uk/mmz4281/2122/E0.csv")
ep = epl[['HomeTeam','AwayTeam','FTHG','FTAG']]
epl = epl.rename(columns={'FTHG': 'HomeGoals', 'FTAG': 'AwayGoals'})
epl.head()

epl = epl[:-10]
Perform the regression
In the fit, we include a parameter for home advantage. Team and opponent are fixed effects.
goal_model_data = pd.concat([epl[['HomeTeam','AwayTeam','HomeGoals']].assign(home=1).rename(
            columns={'HomeTeam':'team', 'AwayTeam':'opponent','HomeGoals':'goals'}),
           epl[['AwayTeam','HomeTeam','AwayGoals']].assign(home=0).rename(
            columns={'AwayTeam':'team', 'HomeTeam':'opponent','AwayGoals':'goals'})])

poisson_model = smf.glm(formula="goals ~ home + team + opponent", data=goal_model_data,
                        family=sm.families.Poisson()).fit()
poisson_model.summary()
Simulating a game
Let’s now simulate a match between City and Arsenal
# Set teams here
home_team='Man City'
away_team='Arsenal'

#Predict for Arsenal vs. Manchester City
home_score_rate=poisson_model.predict(pd.DataFrame(data={'team': home_team, 'opponent': away_team,
                                       'home':1},index=[1]))
away_score_rate=poisson_model.predict(pd.DataFrame(data={'team': away_team, 'opponent': home_team,
                                       'home':0},index=[1]))
print(home_team + ' against ' + away_team + ' expect to score: ' + str(home_score_rate))
print(away_team + ' against ' + home_team + ' expect to score: ' + str(away_score_rate))

#Lets just get a result
home_goals=np.random.poisson(home_score_rate)
away_goals=np.random.poisson(away_score_rate)
print(home_team + ': ' + str(home_goals[0]))
print(away_team + ': '  + str(away_goals[0]))
Man City against Arsenal expect to score: 1    2.481142
dtype: float64
Arsenal against Man City expect to score: 1    0.682894
dtype: float64
Man City: 4
Arsenal: 1
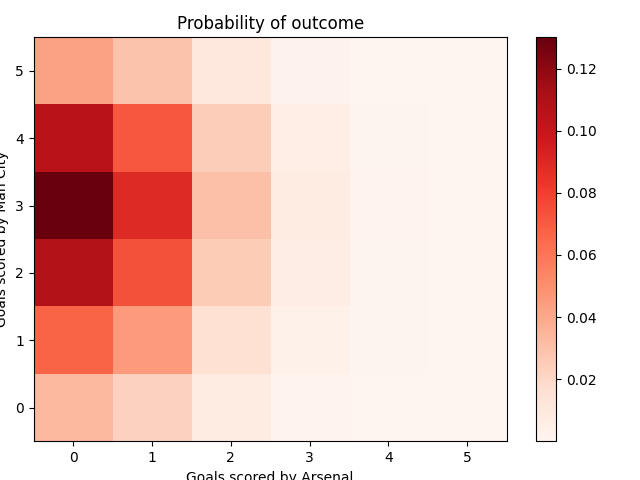
Two-dimensional histogram of scores
This gives the probability of different score lines.
# Code to caluclate the goals for the match.
def simulate_match(foot_model, homeTeam, awayTeam, max_goals=10):
    home_goals_avg = foot_model.predict(pd.DataFrame(data={'team': homeTeam,
                                                           'opponent': awayTeam, 'home': 1},
                                                     index=[1])).values[0]
    away_goals_avg = foot_model.predict(pd.DataFrame(data={'team': awayTeam,
                                                           'opponent': homeTeam, 'home': 0},
                                                     index=[1])).values[0]
    team_pred = [[poisson.pmf(i, team_avg) for i in range(0, max_goals + 1)] for team_avg in
                 [home_goals_avg, away_goals_avg]]
    return (np.outer(np.array(team_pred[0]), np.array(team_pred[1])))

#Fill in the matrix
max_goals=5
score_matrix=simulate_match(poisson_model, home_team, away_team,max_goals)

fig=plt.figure()
ax=fig.add_subplot(1,1,1)
pos=ax.imshow(score_matrix, extent=[-0.5,max_goals+0.5,-0.5,max_goals+0.5], aspect='auto',cmap=plt.cm.Reds)
fig.colorbar(pos, ax=ax)
ax.set_title('Probability of outcome')
plt.xlim((-0.5,5.5))
plt.ylim((-0.5,5.5))
plt.tight_layout()
ax.set_xlabel('Goals scored by ' + away_team)
ax.set_ylabel('Goals scored by ' + home_team)
plt.show()

#Home, draw, away probabilities
homewin=np.sum(np.tril(score_matrix, -1))
draw=np.sum(np.diag(score_matrix))
awaywin=np.sum(np.triu(score_matrix, 1))
Total running time of the script: ( 0 minutes 1.057 seconds)