Note
Click here to download the full example code
Using t-tests
In this tutorial we demonstrate how to check if values are significantly different from each other using t-tests
import pandas as pd
import numpy as np
import json
# plotting
import matplotlib.pyplot as plt
#opening data
import os
import pathlib
import warnings
pd.options.mode.chained_assignment = None
warnings.filterwarnings('ignore')
Opening the dataset
First we open the data. For this example we will use WyScout data from 2017/18 Premier League season. To meet file size requirements of Github, we have to open it from different files, but you can open the file locally from the directory you saved it in. Also, we open the file containing all teams in WyScout database.
#open events
train = pd.DataFrame()
for i in range(13):
    file_name = 'events_England_' + str(i+1) + '.json'
    path = os.path.join(str(pathlib.Path().resolve()), 'data', 'Wyscout', file_name)
    with open(path) as f:
        data = json.load(f)
    train = pd.concat([train, pd.DataFrame(data)])

#open team data
path = os.path.join(str(pathlib.Path().resolve()),"data", 'Wyscout', 'teams.json')
with open(path) as f:
    teams = json.load(f)

teams_df = pd.DataFrame(teams)
teams_df = teams_df.rename(columns={"wyId": "teamId"})
Preparing the dataset
First, we take out corners. Then, we sum them by team. We also merge it together with team dataframe to keep their names. Then we repeat the same, but calculate corners taken by each team per game.
#get corners
corners = train.loc[train["subEventName"] == "Corner"]
#count corners by team
corners_by_team = corners.groupby(['teamId']).size().reset_index(name='counts')
#merge with team name
summary = corners_by_team.merge(teams_df[["name", "teamId"]], how = "left", on = ["teamId"])
#count corners by team by game
corners_by_game = corners.groupby(['teamId', "matchId"]).size().reset_index(name='counts')
#merge with team name
summary2 = corners_by_game.merge(teams_df[["name", "teamId"]], how = "left", on = ["teamId"])
One-sample one-sided t-test
Imagine that it is established that teams tyoically get 6 corners in a match in football. City are an attacking team and we might think that they get more corners than this. Let’s start by plotting a distribution of City’s corners.
team_name= 'Manchester City'

city_corners = summary2.loc[summary2["name"] == 'Manchester City']["counts"]

def FormatFigure(ax):
    ax.legend(loc='upper left')
    ax.set_ylim(0,0.25)
    ax.spines['top'].set_visible(False)
    ax.spines['right'].set_visible(False)
    ax.set_ylabel('')
    ax.set_xlabel('Corners')
    ax.set_ylabel('Proportion of games')
    ax.set_xticks(np.arange(0,21,step=1))


fig,ax1=plt.subplots(1,1)
ax1.hist(city_corners, np.arange(0.01,20.5,1), color='lightblue', edgecolor = 'white',linestyle='-',alpha=0.5, label=team_name, density=True,align='right')
FormatFigure(ax1)


mean = city_corners.mean()
std = city_corners.std()

print('City typically had %.2f  plus/minus %.2f corners per match in the 2017/18 season.'%(mean,std))
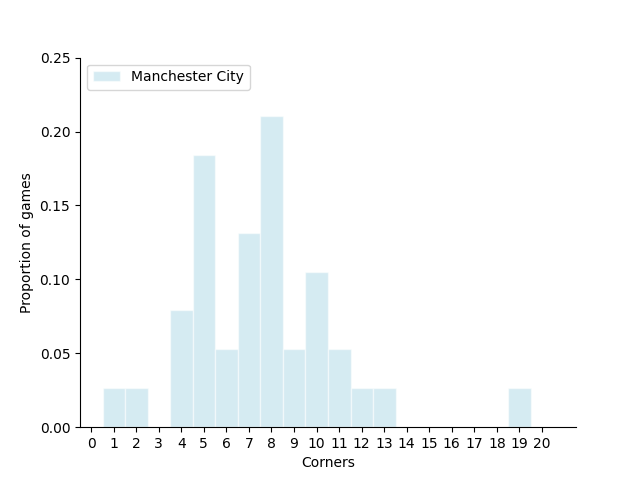
City typically had 7.50 plus/minus 3.28 corners per match in the 2017/18 season.
We use can use a one-sided t-test to check if Manchester City took more corners than we might expect due to normal variation in the number of corners we tend to see. We set the significance level at 0.05.
from scipy.stats import ttest_1samp
t, pvalue = ttest_1samp(city_corners,popmean=6)

print("The t-staistic is %.2f and the P-value is %.2f."%(t,pvalue))
if pvalue < 0.05:
    print("We reject null hypothesis - " + team_name + " typically take more than 6 corners per match.")
else:
    print("We cannot reject null hypothesis - " + team_name + " do not typically take more than 6 corners per match.")
The t-staistic is 2.82 and the P-value is 0.01.
We reject null hypothesis - Manchester City typically take more than 6 corners per match.
At this significance level, there’s a reason to reject the null hypothesis. It is reasonable to say that City take more corners than what is considered normal for a typical team (i.e. 6).
Two-sample two-sided t-test
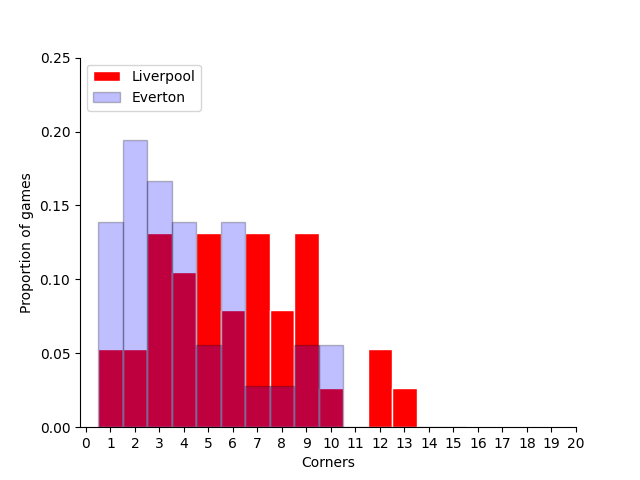
Here we compare Liverpool and Everton in terms of corners per match.
liverpool_corners = summary2.loc[summary2["name"] == 'Liverpool']["counts"]
everton_corners = summary2.loc[summary2["name"] == 'Everton']["counts"]

mean = liverpool_corners.mean()
std = liverpool_corners.std()
print('Liverpool typically had %.2f plus/minus %.2f corners per match in the 2017/18 season.'%(mean,std))
std_error=std/np.sqrt(len(liverpool_corners))
print('The standard error in the number of corners per match is %.4f'%std_error)

mean = everton_corners.mean()
std = everton_corners.std()
print('Everton typically had %.2f plus/minus %.2f corners per match in the 2017/18 season.'%(mean,std))
std_error=std/np.sqrt(len(everton_corners))
print('The standard error in the number of corners per match is %.4f'%std_error)
Liverpool typically had 6.08 plus/minus 3.06 corners per match in the 2017/18 season.
The standard error in the number of corners per match is 0.4966
Everton typically had 4.17 plus/minus 2.66 corners per match in the 2017/18 season.
The standard error in the number of corners per match is 0.4428
Now let’s plot the corners as a histogram.
fig,ax=plt.subplots(1,1)
ax.hist(liverpool_corners, np.arange(0.01,15.5,1), color='red', edgecolor = 'white',linestyle='-',alpha=1.0, label="Liverpool", density=True,align='right')
ax.hist(everton_corners, np.arange(0.01,15.5,1), alpha=0.25, color='blue', edgecolor = 'black', label='Everton',  density=True,align='right')
FormatFigure(ax)
# Here we test if Liverpool had a different average corners per game than Everton.
# We set the significance level at 0.05.


from scipy.stats import ttest_ind
t, pvalue  = ttest_ind(a=liverpool_corners, b=everton_corners, equal_var=True)

print("The t-staistic is %.2f and the P-value is %.2f."%(t,pvalue))
if pvalue < 0.05:
    print("We reject null hypothesis - Liverpool took different number of corners per game than Everton")
else:
    print("We cannot reject the null hypothesis that Liverpool took the same number of corners per game as Everton")
The t-staistic is 2.86 and the P-value is 0.01.
We reject null hypothesis - Liverpool took different number of corners per game than Everton
The t-statistic (roughly) measures how many standard errors the two means are from each other.
Total running time of the script: ( 0 minutes 8.356 seconds)