Improving your visuals
We have focussed on getting the basics right in this section. There is however a lot more to learn about visualisation and, in particular, how to communicate with graphics.
Peter McKeever
A great starting point is StatsPerform’s Peter McKeever who gives great insight in to how to make better data visualisations.
Peter has an excellent website with code and further examples. He also mentioned in the talk the blog by Lisa Charlotte Muth.
Maram AlBaharna
Maram creates unique visuals using from football data. In this Friends of Tracking episode, we talked to her about how she works.
The work she did online landed her a job at The Athletic.
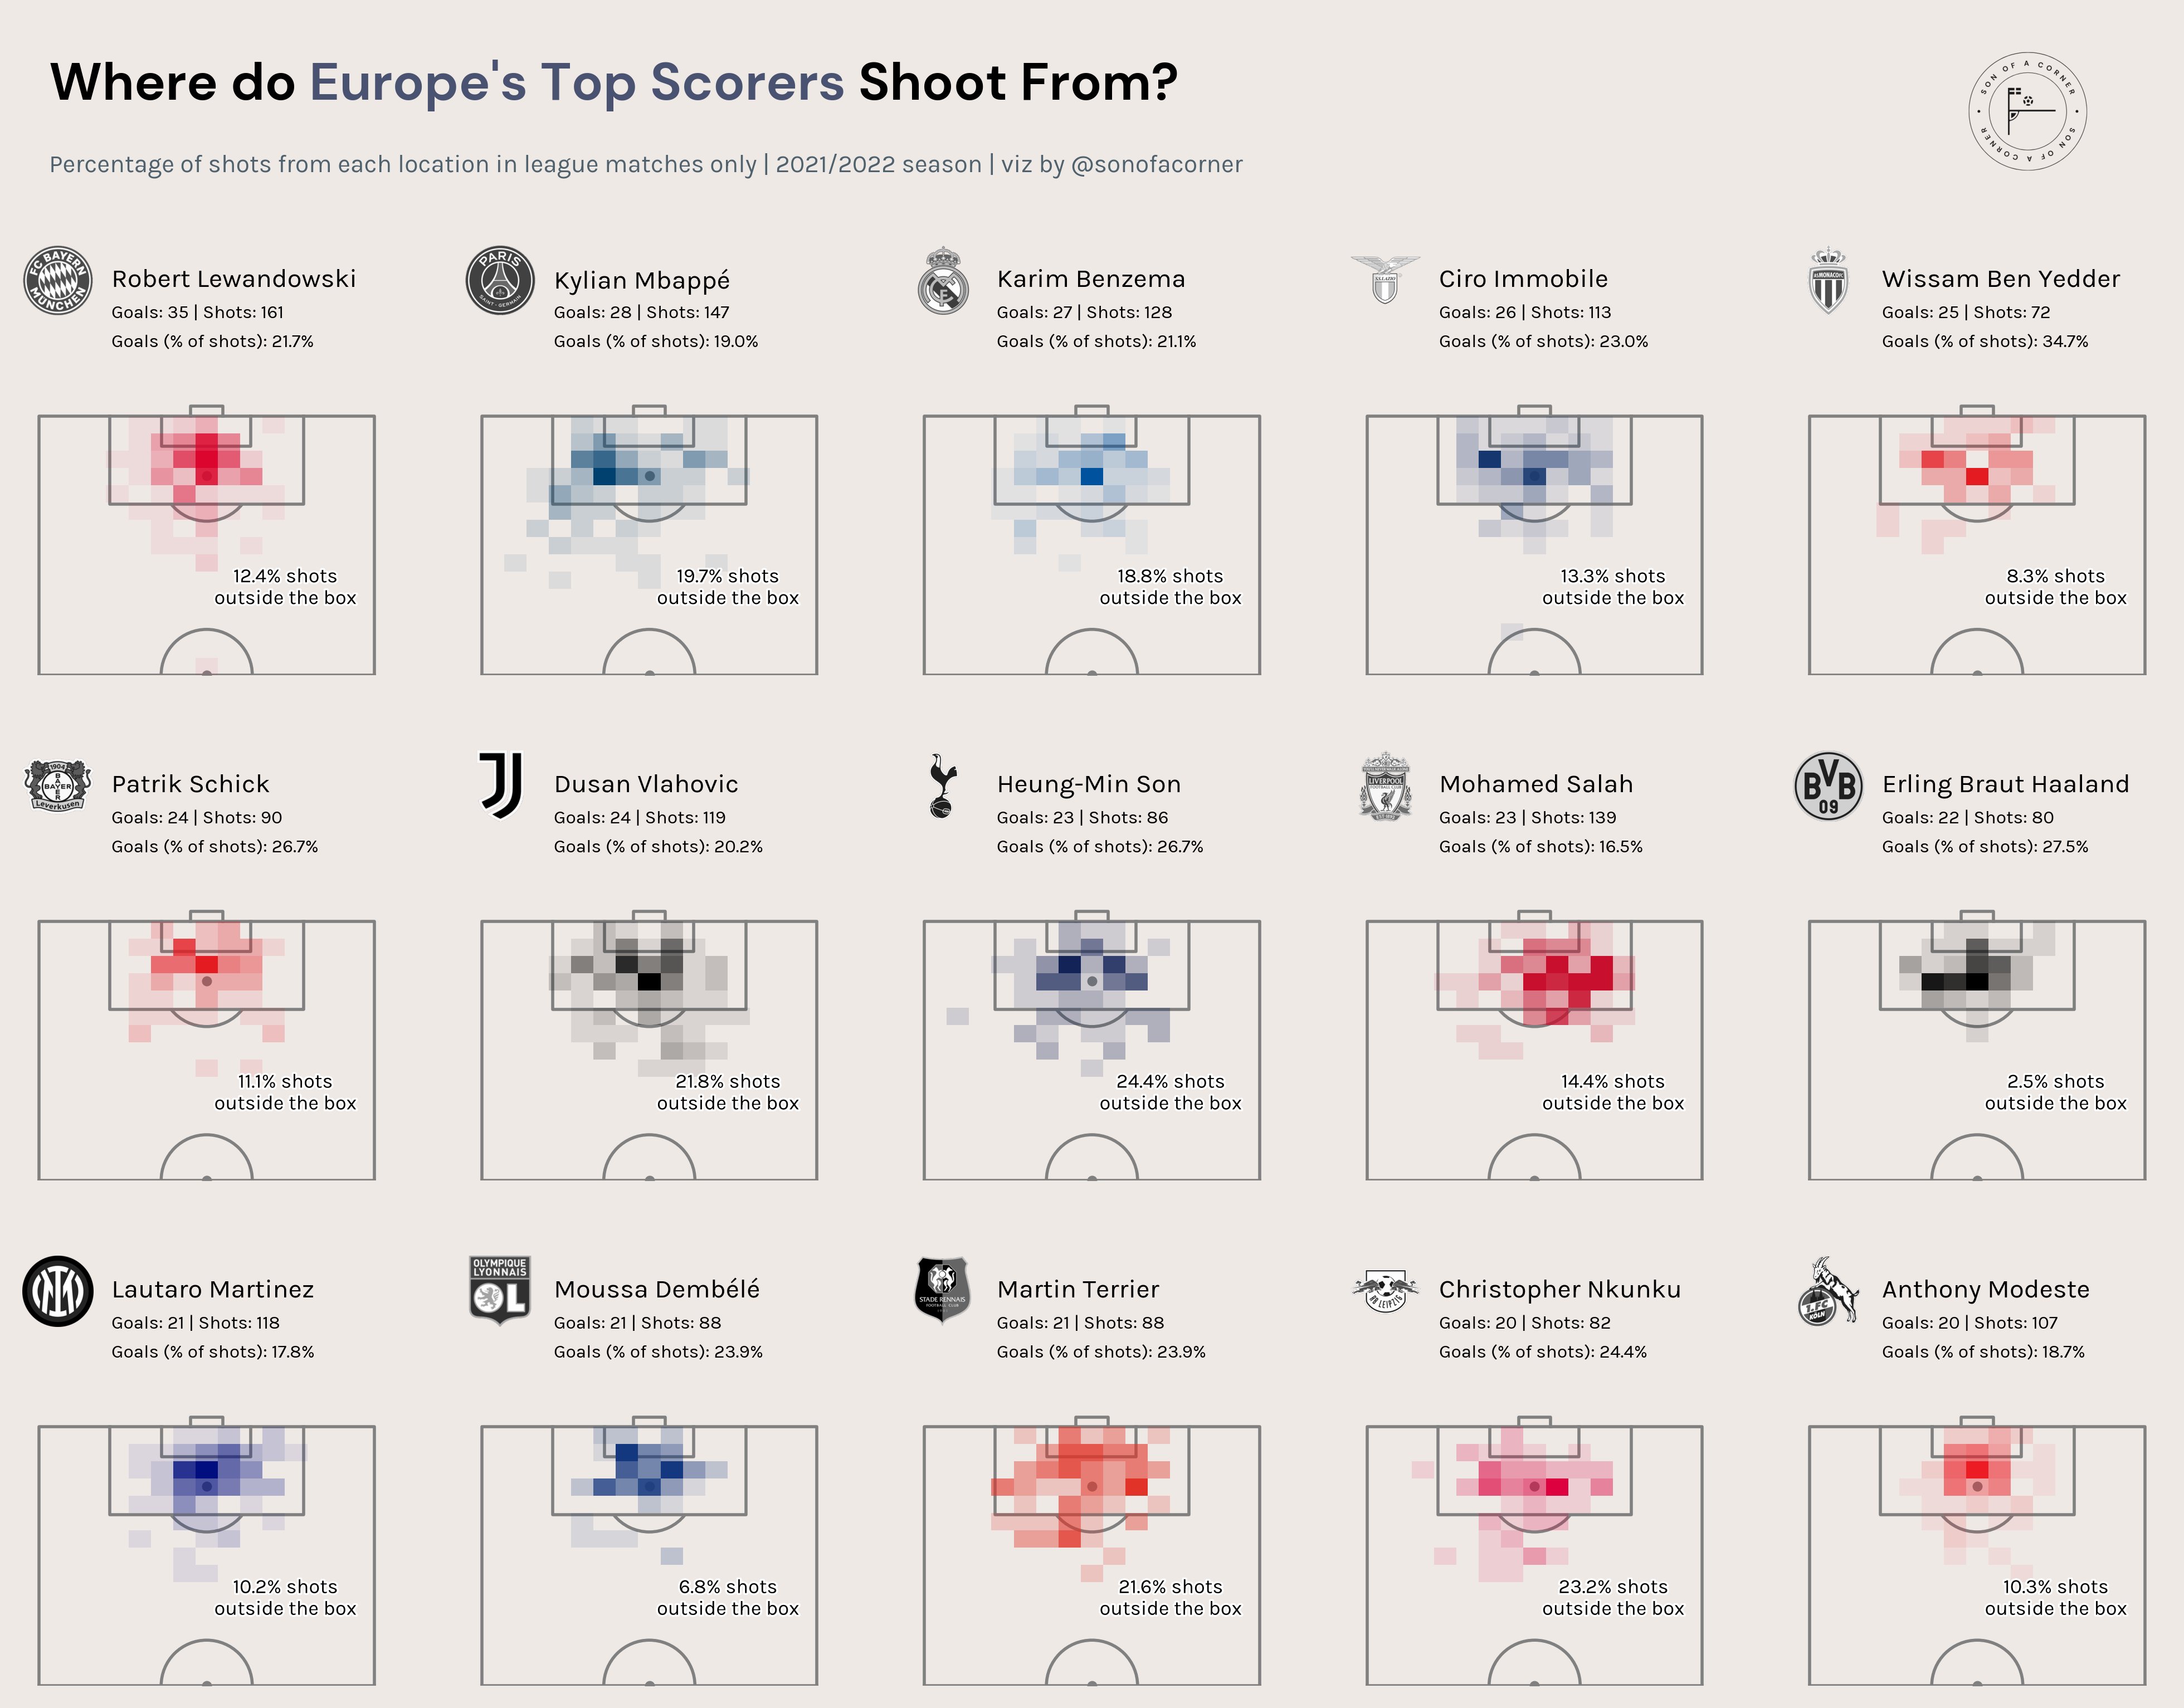
Son of a corner
Another ‘up and coming’ football visualiser is Son of a Corner. Here are heat shot maps for top strikers around Europe
If you want to follow his method, he gives a step-by-step guide here.