Twelve Visualisations
In this video, we look through some of the Twelve community code. This provides functionality for picking a season, a match and making basic plots of shots, passes etc.
Below is the code from the example davids_first_streamlit.py I look at in the video.
We define one function for creating the sidebar. This calls the Twelve API to get the competitions, then uses st.sidebar to create the sidebar on the left.
def sidebar_select_competition():
    # Single selector for competition
    competitions = twelve.competitions()
    selected_competition_id = st.sidebar.selectbox("Competition", competitions,     format_func=lambda x: competitions[x])

    return  competitions, selected_competition_id


# Use default settings
create_default_configs()

st.header("David plots passes")

# Sidebar menu
competitions, selected_competition_id = sidebar_select_competition()
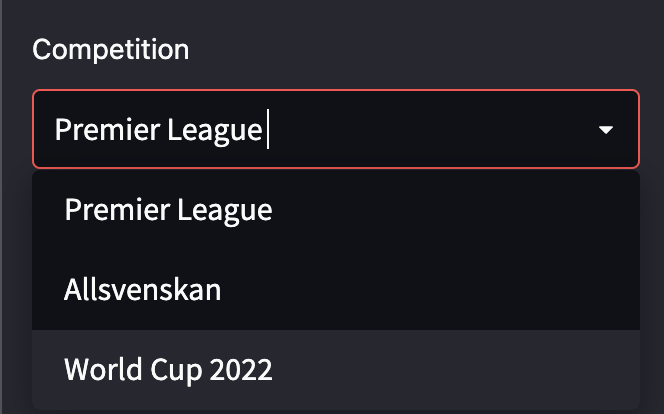
Here is how the sidebar looks:
Next we do the same for matches within the competition. Notice how we index in order to get both the teams and the score.
# Get all available matches
matches = twelve.app_get_matches(selected_competition_id)

# Create Dictionary of matches
matches_dict = {x['matchId']: f"{x['homeTeam']['name']} {x['homeTeam']['score']}-{x['awayTeam']['score']} {x['awayTeam']['name']}" for x in matches}

# select match
selected_match_id = st.sidebar.selectbox("Match", matches_dict, format_func=lambda x:matches_dict[x])
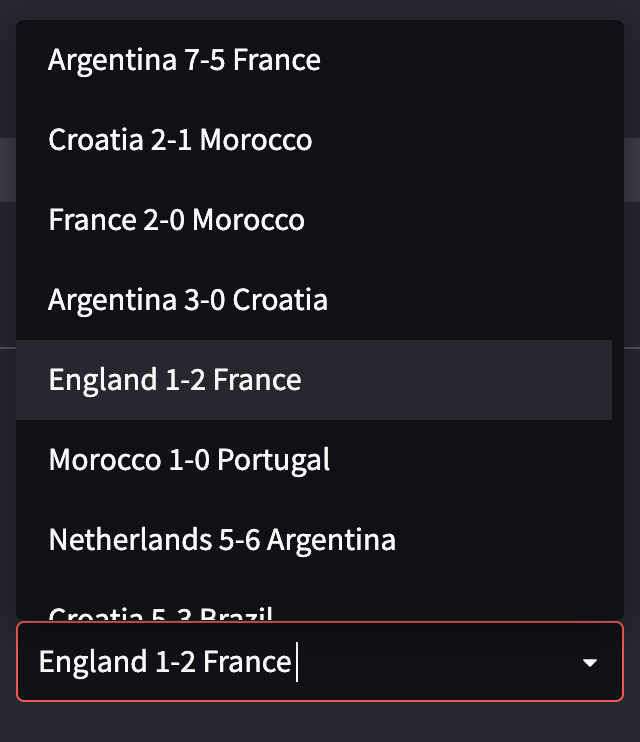
Here is the sidebar which the code creates
Now for the main part of the code. We make a button for passes (we could add more buttons here like we do in page_match.py). This calls the Twelve API to get passses for the selected match, which is stores in a dataframe df_passes. We can filter for goalkicks, throwins and passes. And we can also show passes that have more than a certain xT value (which we call Twelve points here). The ramining code creates the visual.
# Buttons
selected_sub_nav = st_row_buttons(['Passes'])

if  selected_sub_nav == 'Passes':

    # get match data - passes

    passes = twelve.get_match_passes(selected_match_id)

    # Home Team passes
    df_passes = pd.DataFrame(passes['HomeTeamPasses'])
    df_passes = df_passes[df_passes['type'].isin(['goalkick'])] #throw-in,pass

    #Filter for passes with more than a certain number of Twelve points.
    df = df[df['points'] >= 0]

    viz = TwelvePitchVisual("Match passes", "pass types")

    viz.info_text = f"Info text"

    fig, ax = viz.create_pass_visual(df_passes['startX'],
             df_passes['startY'],
             df_passes['endX'],
             df_passes['endY'],
             df_passes['points'])

    st.columns(3)[0].pyplot(fig, dpi=100, facecolor=fig.get_facecolor(), bbox_inches=None)

    st.write(passes)
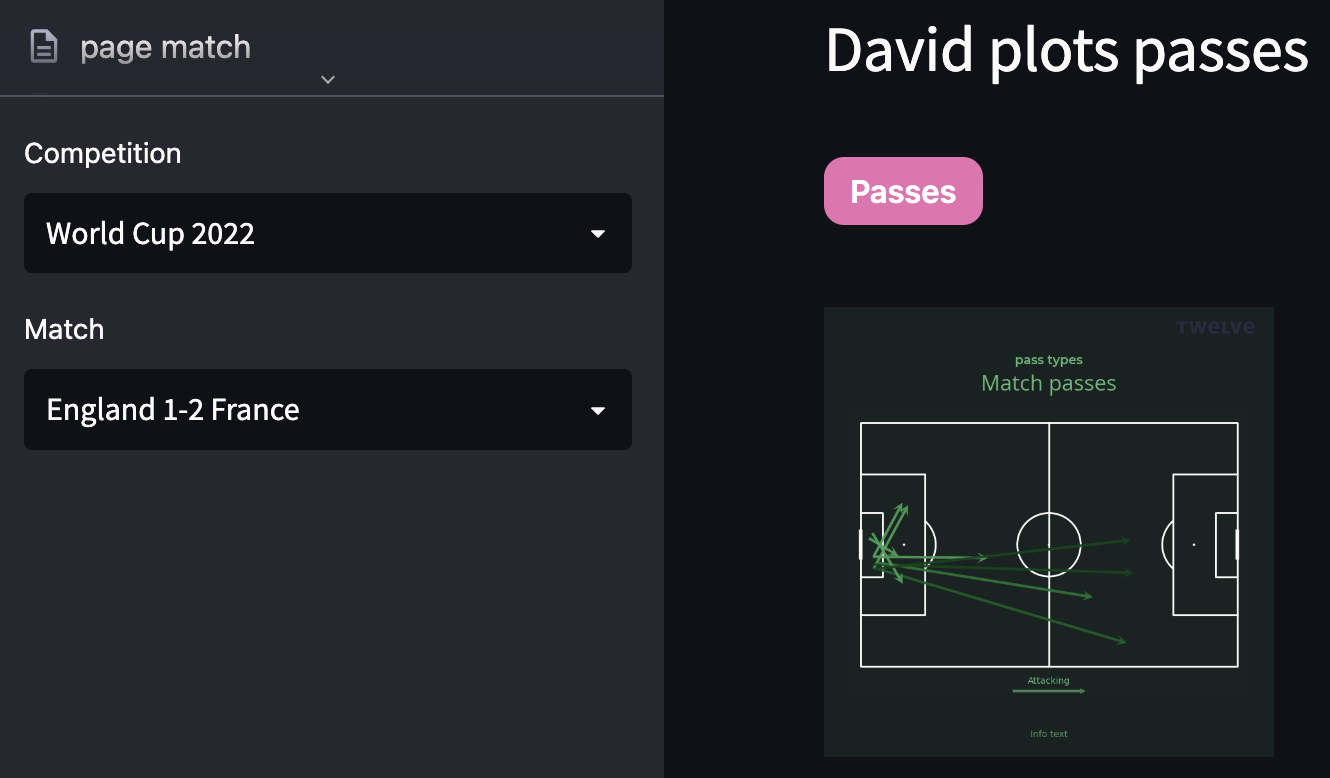
The passes are plotted in the app as follows.
The last line of the code st.write(passes) allows us to write out the .json file within the app.