Note
Click here to download the full example code
Modelling the relationship between EPV added and distance covered
In this tutorial we will model the relationship between EPV added and distance covered. The code bases on Sudarshan “Suds” Gopaladesikan’s code provided for Friends of Tracking.
import Metrica_IO as mio
import Metrica_Viz as mviz
import Metrica_Velocities as mvel
import matplotlib.pyplot as plt
import numpy as np
import pandas as pd
import Metrica_PitchControl as mpc
import Metrica_EPV as mepv
from sklearn.linear_model import LinearRegression
import warnings
warnings.filterwarnings("ignore")
pd.options.mode.chained_assignment = None
Opening data
For this task we will use Metrica data. We open it using Laurie Shaw’s codes. We make separate dataframes for home and away teams as well as for events. Then we adjust the direction so the teams attack the same direction for both halves.
DATADIR = '../data/Metrica'
game_id = 2  # let's look at sample match 2

# read in the event data
events = mio.read_event_data(DATADIR, game_id)

# read in tracking data
tracking_home = mio.tracking_data(DATADIR, game_id, 'Home')
tracking_away = mio.tracking_data(DATADIR, game_id, 'Away')

# Convert positions from metrica units to meters (note change in Metrica's coordinate system since the last lesson)
tracking_home = mio.to_metric_coordinates(tracking_home)
tracking_away = mio.to_metric_coordinates(tracking_away)
events = mio.to_metric_coordinates(events)

# reverse direction of play in the second half so that home team is always attacking from right->left
tracking_home, tracking_away, events = mio.to_single_playing_direction(tracking_home, tracking_away, events)

GK_numbers = [mio.find_goalkeeper(tracking_home),mio.find_goalkeeper(tracking_away)]
home_attack_direction = mio.find_playing_direction(tracking_home,'Home') # 1 if shooting left-right, else -1

#Set some global variables
player_ids = np.unique(list(c[:-2] for c in tracking_home.columns if c[:4] in ['Home', 'Away']))
maxspeed = 12
dt = tracking_home['Time [s]'].diff()
second_half_idx = tracking_home.Period.idxmax()

# Using Laurie's smoothing code
tracking_home = mvel.calc_player_velocities(tracking_home, smoothing=True)
tracking_away = mvel.calc_player_velocities(tracking_away, smoothing=True)

#Obtain the Unique Players
home_players = np.unique(list(c.split('_')[1] for c in tracking_home.columns if c[:4] == 'Home'))
away_players = np.unique(list(c.split('_')[1] for c in tracking_away.columns if c[:4] == 'Away'))
Reading team: home
Reading team: away
Calculate values for each home team’s possession chain
First, we have to load the EPV grid trained by Laurie Show (it is in fact possession-based xT trained on a grid 100x100). Then, we take all possession chains by the home team. For each of the sequence we calculate distance coverd by the home team and EPV added during that sequence.
params = mpc.default_model_params()

#load epv
EPV = mepv.load_EPV_grid(DATADIR+'/EPV_grid.csv')

#get all possession chains
pass_events = events[events['Type'] == 'PASS']
pass_events['Poss_Seq'] = pass_events['Team'].ne(
    pass_events['Team'].shift()).cumsum()

home_poss = pass_events[pass_events['Team']=='Home']

home_poss_list = []
for i in np.unique(home_poss['Poss_Seq']):
    #start of the sequence
    start_time = min(home_poss[home_poss['Poss_Seq']==i]['Start Time [s]'])
    #end of the sequence
    end_time = max(home_poss[home_poss['Poss_Seq']==i]['End Time [s]'])
    #differentiate between halves
    half_temp = np.unique(home_poss[home_poss['Poss_Seq']==i]['Period'])
    pass_poss = home_poss[home_poss['Poss_Seq']==i]

    #calculate distance
    poss_distance = []
    tracking_poss = tracking_home[(tracking_home['Time [s]']>=start_time) & (tracking_home['Time [s]']<=end_time) & (tracking_home['Period'].isin(half_temp))]
    for player in home_players:
        column = 'Home_' + player + '_speed'
        player_distance = tracking_poss.loc[tracking_poss[column] >= 3,column].sum() / 25. / 1000
        poss_distance.append(player_distance)

    #calculate epv added
    eepv_added = []
    for i in pass_poss.index:
        EEPV_added, EPV_diff = mepv.calculate_epv_added(i, events, tracking_home, tracking_away, GK_numbers,
                                                        EPV, params)
        eepv_added.append(EEPV_added)
    #sum it
    total_dist = np.sum(poss_distance)
    total_eepv = np.sum(eepv_added)
    home_poss_list.append([total_dist, total_eepv])
#save in a dataframe
home_eepv_df = pd.DataFrame(np.array(home_poss_list).reshape(68,2), columns = ['HomeDist','EEPV'])
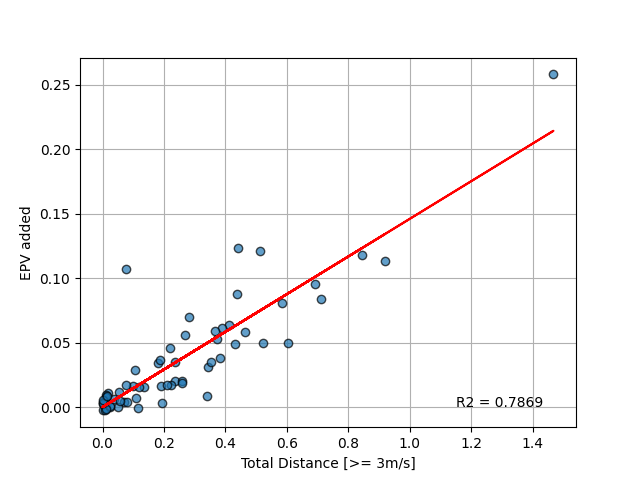
Fitting linear regression
Now we can fir linear regression to our data. We do it using sklearn module. R2 score amounts to 78.69% which is a high score signifing that distance covered during possession chain by team’s players influence EPV added.
lr = LinearRegression()
lm = lr.fit(np.array(home_eepv_df['HomeDist']).reshape(-1,1),np.array(home_eepv_df['EEPV']).reshape(-1,1))
lm_score = lm.score(np.array(home_eepv_df['HomeDist']).reshape(-1,1),np.array(home_eepv_df['EEPV']).reshape(-1,1))
yhat = lm.predict(np.array(home_eepv_df['HomeDist']).reshape(-1,1))

plt.scatter(home_eepv_df['HomeDist'],home_eepv_df['EEPV'], edgecolor = 'k', alpha = 0.7, zorder = 2)
plt.plot(home_eepv_df['HomeDist'],yhat, color="red", zorder = 3)
plt.xlabel("Total Distance [>= 3m/s]")
plt.ylabel("EPV added")
plt.annotate('R2 = ' + str(lm_score)[:6], xy=(1.15,0))
plt.grid(zorder = 1)
plt.show()
Total running time of the script: ( 0 minutes 2.752 seconds)