Note
Click here to download the full example code
Simulating a match
Before we get started, we are going to simulate a football match using a very simple model. One in which goals occur completely at random during the match.
import numpy as np
import numpy.random as rnd
import time
import pylab as plt
Setting parameters
Lets set up the basic scoring rates for football
#Length of match
match_minutes = 90
#Average goals per match
goals_per_match = 2.79
#Probability of a goal per minute
prob_per_minute = np.array(goals_per_match/match_minutes)
print('The probability of a goal per minute is %5.5f. \n' % prob_per_minute )
The probability of a goal per minute is 0.03100.
Simulating a single game
Now we simulate a single game. Goals go in with the same probability every minute. Run the simulation below 10 times. How many times were there 3 goals in a match?
#Count of the number of goals
goals=0

for minute in range(match_minutes):

  #Generate a random number between 0 and 1.
  r=rnd.rand(1,1)

  #Prints an X when there is a goal and a zero otherwise.
  if (r < prob_per_minute):
    #Goal - if the random number is less than the goal probability.
    print('X', end = ' ')
    goals=goals+1
    time.sleep(1)  #Longer pause
  else:
    print('o', end = ' ')
    time.sleep(0.1)  #Short pause
print('\n')
print('Final whistle. \n \nThere were ' + str(goals) + ' goals.')
o o o o o o o o o o o X o o o o o o o o o o o X o o o o o o o o o o o X o o o o o o o o o o o o o o o o o o o o o o o o o o o o o o o o o o o o o o o o o o o o o o o o o o o o o o

Final whistle.

There were 3 goals.
It is likely that about 2 or 3 of your simulations ended with 3 goals. Most matches have between 0 and 5 goals. It is likely you saw at most one match with 0 goals.
Simulating goals over a season
#  We now simulate 380 matches of a football season and look at how well it predicts the
#  distribution of the number of goals. This is done in the code below: we loop over 380 matches,
#  store the number of goals for each match in array and then we make a histogram of the number of goals.
#


def simulateMatch(n, p):
  # n - number of time units
  # p - probability per time unit of a goal
  # display_match == True then display simulation output for match.

  # Count the number of goals
  goals = 0

  for minute in range(n):
      # Generate a random number between 0 and 1.
      r = rnd.rand(1, 1)
      # Prints an X when there is a goal and a zero otherwise.
      if (r < p):
        # Goal - if the random number is less than the goal probability.
        goals = goals + 1

  return goals

# Number of matches
num_matches = 380

# Loop over all the matches and print the number of goals.
goals = np.zeros(num_matches)
for i in range(num_matches):
  goals[i] = simulateMatch(match_minutes, prob_per_minute)
  #print('In match ' + str(i+1) + ' there were ' + str(int(goals[i])) + ' goals.')

# Create a histogram

fig, ax = plt.subplots(num=1)

histogram_range = np.arange(-0.5, 10.51, 1)
histogram_goals = np.histogram(goals, histogram_range)

ax.bar(histogram_goals[1][:-1] + 0.5, histogram_goals[0], color='white', edgecolor='black', linestyle='-', alpha=0.5)
ax.set_ylim(0, 100)
ax.spines['top'].set_visible(False)
ax.spines['right'].set_visible(False)
ax.set_xticks(np.arange(0, 11, step=1))
ax.set_yticks(np.arange(0, 101, step=20))
ax.set_xlabel('Number of goals')
ax.set_ylabel('Number of matches')
plt.show()
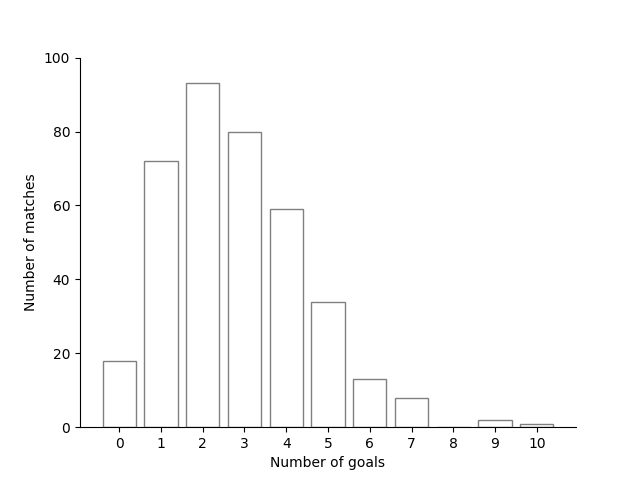
Run the code a few times and look at the resulting histogram. Now we have seen this simulation, we can look at football…
Total running time of the script: ( 0 minutes 11.797 seconds)